Online Experiments Analysis Best Practice
Before we fully release a new feature into production, we often rely on AB tests to determine the outcome of an online experiments. But we always forget to pay attention to some important yet unrealized mistakes during the experiments.
If you are a product manager and designing an experiment for a new feature, you need to get a check list with following suggestions.
Decide the KPI after the experiment is online
We often design the new feature without explicitly writing down what we want to achieve quantitatively. After the AB test is online, we then rush to get the analysis reports to see if the new feature is performing up to the level of our expectations.
The danger here is that, if the result is NOT meeting your expectations, you will be very eager to change your KPIs to justify that new feature is giving positive influence. For instance, you released a “lucky draw” feature in your game. The AB test result shows DAU goes up, but revenue goes down. Seeing the result at the end of the experiment, you’ll “believe” that you designed “lucky draw” to increase DAU. But really, we didn’t know what we wanted at the beginning.
Solution:
We should define clearly the KPIs during the design phase of the new feature, even should give estimations on how much the KPIs should be changing, e.g., DAU up by 1%, or DAU drop less than 1% but Revenue up by 2%. By writing them down, not only we can prevent the hustle of getting the KPI reports after AB test, but also, we force ourselves to think deeply into the design and carry the target all along.
Compare Users who used the new feature vs users who did not
This is a very common mistake when we want to make a “Causal” analysis. We may define something like Group A (users used new feature) vs Group B (users did not).
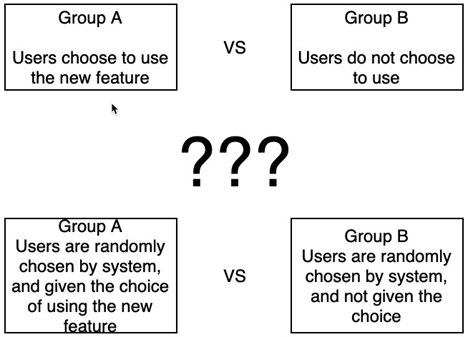
If “using the new feature” is a choice, users go into Group A or B also become a user’s choice, while choice is not a Treatment we can control. Hence the analysis of A-B tells us the impact from difference between the “Willingness” of group A and B. But what we really want to find out is “if we give the choice to users, will we see a revenue gain?” We can’t control the users’ willingness, but we can control if we give users the choice or not.
Solution:
If we really want to analyze something we can “Control”, the simplest way is always randomly assign users into Group A and B, and compare the entire groups.
The problem with the solution is that maybe only 1% of the users opt-in for the new feature, hence the impact of this 1% is diluted by the other 99%. How to solve this problem? Please refer to our future Blogs.
Rely on Delta Report only rather than DID report
When we randomly assigned users into group A and B, we believe they have no statistical indifference. Hence, we can use (Average of Revenue from A) – (Average of Revenue from B) to tell which group is performing better.
But factually, there is always a pre-existing difference between A and B even if they are randomly assigned. Regarding details of how to use DID analysis, please refer to our blog: https://happyelements.us/applying-difference-to-difference-analysis-in-gaming/